Contents
- Acknowledgements
- Practice Analysis Task Force
- Introduction to a Practice Analysis
- Executive Summary & Results Highlights
- Survey Return Rate
- Results Related to Professional Background, Demographic Information and Work Setting
- Results Related to Domains, Tasks, Knowledge and Skill Statements
- Domains
- Tasks
- Knowledge and Skill Statements
- Orthotic Practice Areas and Orthoses
- Prosthetic Practice Areas and Devices
- Methodology
©2026 by the American Board for Certification in Orthotics, Prosthetics & Pedorthics, Inc. All rights reserved.
No part of this document may be produced in any form without written permission of the American Board for Certification in Orthotics, Prosthetics & Pedorthics, Inc.
Practice Analysis of Certified Practitioners in the Disciplines of Orthotics and Prosthetics
September 2022
Prosthetic Practice Areas and Devices
Participants who indicated that they had provided direct patient care in the last 12 months were presented with a section covering either orthotic or prosthetic practice areas, as well as additional discipline-specific questions. Participants were directed to the orthotics or prosthetics section based on the discipline track they were assigned for the survey depending on their credential (CO or CP), or their preference for dually credentialed (CPO) practitioners. The results of these ratings provide guidance with regard to the development and/or refinement of ABC’s certification examinations. The results also provide guidance to the National Commission on Orthotic and Prosthetic Education (NCOPE) in the development of orthotic and prosthetic residency and education standards.
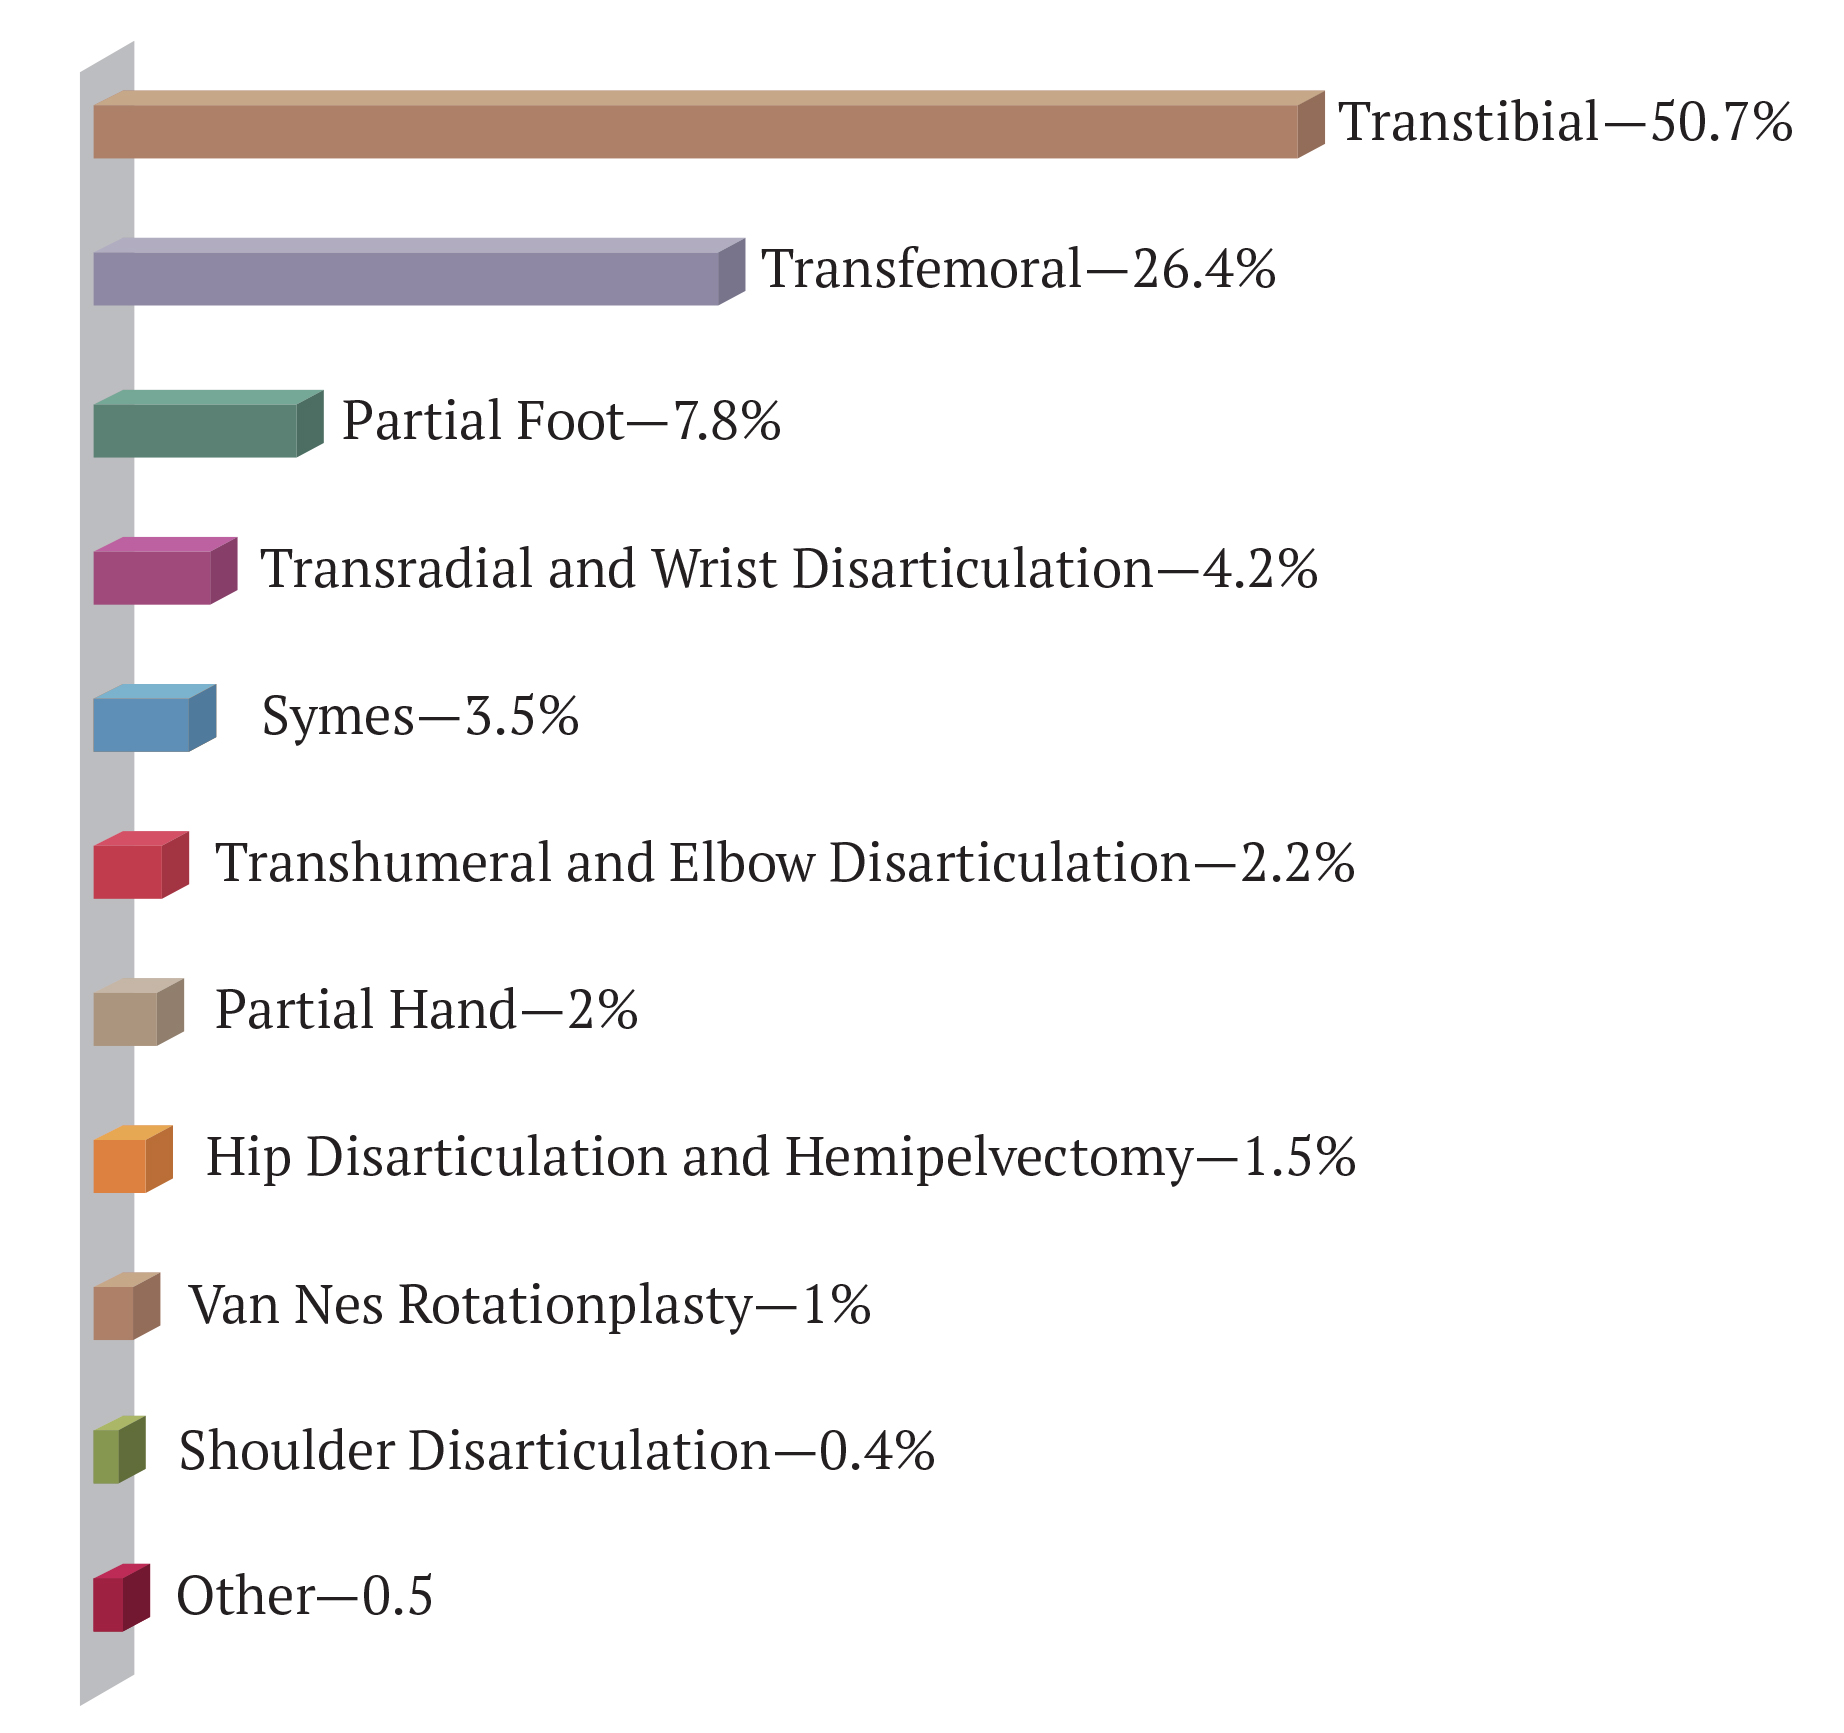
Prosthetics-track respondents were asked to rate the percentage of time they spend in various prosthetic practice areas. Figure 2 shows the average overall allocation of prosthetic practitioners’ time in the practice areas. As can be seen, practitioners spend more than half of their time in the trans-tibial practice area and just more than a quarter of their time in the transfemoral/knee disarticulation area. The only other practice area that prosthetists spend more than 5% of their time in was partial foot at about 8%.
Figure 2 – Percentage of Time in Prosthetic Practice Areas
Participants were then asked to indicate the percentage of prostheses that incorporated the listed socket designs, suspension systems, and control systems. Table 34 lists the percentages for the socket designs, suspension systems, and control systems
within each of six practice areas.
Half of the trans-tibial socket designs reported were a hybrid design. Prosthetists were most likely to use a roll-on liner with lock or lanyard, reporting that they use this type of suspension system in almost half of their trans-tibial interventions.
More than three quarters of the transfemoral prostheses provided incorporate an ischial containment socket design. Similar to the trans-tibial area, prosthetist most commonly used a roll-on liner with lock or lanyard, reporting they use this suspension system in half of their transfemoral/knee disarticulation patients.
In both of the upper extremity practice areas, prosthetists continue to be more likely to provide a body-powered versus a myoelectric control system.
Table 35
| PRACTICE AREA | Area | Socket Designs/ Suspension Systems |
|---|---|---|
| 1. TRANSTIBIAL | 51% | % of Practice |
| Socket Designs | ||
| Patella tendon bearing | 5.7% | |
| Total surface bearing | 19.3% | |
| Hybrid | 25.7% | |
| Suspension Systems | ||
| Supracondylar or anatomical | 2.3% | |
| Joints and corset | 0.6% | |
| Waist belt only | 0.2% | |
| Cuff or strap suspension | 0.4% | |
| Sleeve only | 3.6% | |
| Roll-on liner with lock or lanyard | 22.7% | |
| Roll-on liner, suction with other accessories, (seal or sleeve) | 15.4% | |
| Vacuum-assisted | 5.5% | |
| 2. TRANSFEMORAL AND KNEE DISARTICULATION | 26% | |
| Socket Designs | ||
| Distal end bearing | 1.0% | |
| Quadrilateral | 1.1% | |
| Ischial containment | 20.1% | |
| Ramal containment (e.g., M.A.S. design) | 0.9% | |
| Sub-ischial | 3.3% | |
| Suspension Systems | ||
| Hip joint/pelvic band/waist belt | 0.5% | |
| Suction suspension with expulsion valve (skin fit) | 3.3% | |
| Roll-on liner with lock or lanyard | 13.1% | |
| Roll-on liner, suction with other accessories (seal, sleeve) | 7.9% | |
| Vacuum-assisted | 1.0% | |
| Anatomical suspension | 0.6% |
| PRACTICE AREA | Area | Control Systems/ Suspension Systems |
|---|---|---|
| 3. TRANSRADIAL AND WRIST DISARTICULATION | 4% | |
| Control Systems | ||
| Passive and/or aesthetic | 0.4% | |
| Body-powered | 2.1% | |
| Myoelectric (one- or two-site systems) | 1.4% | |
| Myoelectric (pattern recognition or TMR) | 0.3% | |
| Suspension Systems | ||
| Harness | 1.6% | |
| Suction suspension (skin fit) | 0.8% | |
| Roll-on liner with lock or lanyard | 0.5% | |
| Roll-on liner, suction with other accessories, (seal or sleeve) | 0.2% | |
| Anatomical suspension | 1.1% | |
| 4. TRANSHUMERAL AND ELBOW DISARTICULATION | 2% | |
| Control Systems | ||
| Passive and/or aesthetic | 1.2% | |
| Body-powered | 0.4% | |
| Myoelectric (one- or two-site systems) | 0.3% | |
| Myoelectric (pattern recognition or TMR) | 0.1% | |
| Hybrid, myo/body-powered | 0.3% | |
| Suspension Systems | ||
| Harness | 1.2% | |
| Suction suspension (skin fit) | 0.4% | |
| Roll-on liner with lock | 0.4% | |
| Roll-on liner, suction with other accessories (seal, sleeve) | 0.1% | |
| Anatomical suspension | 0.0% |
| PRACTICE AREA | Area | Socket Designs/ Suspension Systems |
|---|---|---|
| 5. SYMES | 4% | |
| Socket Designs | ||
| Patella tendon bearing | 0.7% | |
| Total surface bearing | 1.6% | |
| End bearing | 1.2% | |
| Suspension Systems | ||
| Self-suspending (via pad or soft insert) | 1.4% | |
| Removable window/door | 1.5% | |
| Expandable wall | 0.2% | |
| Roll-on liner with expulsion valve | 0.3% |
| PRACTICE AREA | Area | Characteristics |
|---|---|---|
| 6. PARTIAL FOOT | 8% | |
| In-shoe submalleolar | 4.8% | |
| Ankle height supramalleolar | 0.8% | |
| End bearing | 2.2% |
In the prosthetics-specific section, participants answered a series of additional questions about the prosthetic devices they provided within the last 12 months. Results are shown below in Tables 36-42.
Table 36
| K1 | 7% |
| K2 | 39% |
| K3 | 45% |
| K4 | 9% |
| Total | 100% |
The biggest changes seen in the prosthetic feet category versus the 2015 study was in the percentage of feet in the hydraulic category. This category doubled from 6% to 12%, and the SACH category decreased from 8% to four percent.
Table 37
| SACH | 4% |
| Single axis | 4% |
| Flexible keel | 22% |
| Dynamic response | 32% |
| Dynamic response shank foot system with vertical loading | 18% |
| Hydraulic | 12% |
| Microprocessor controlled, powered foot and ankle systems | 3% |
| Running/sports | 4% |
| Other | 1% |
| Total | 100% |
The categories of prosthetic knee components were expanded, and additional specificity was added to the choices. This makes comparison to the previous study difficult. The microprocessor category did increase from 19% to 26%. One factor may be the inclusion of powered type of microprocessor knees, which was not listed in the 2015 survey
Table 38
| Manual lock | 11% |
| Single axis constant friction | 4% |
| Single axis with pneumatic/hydraulic control | 10% |
| Weight activated stance control | 20% |
| Polycentric constant friction | 9% |
| Polycentric with pneumatic/hydraulic control | 20% |
| Microprocessor, including powered | 26% |
| Other | 1% |
| Total | 100% |
The biggest change in the type of terminal device provided to upper extremity prosthetic patients was in the multi-articulated hand (e.g., I-Limb, Bebionic) category. Prosthetists reported using this type of terminal device 18% of the time compared to 10% previously.
Table 39
| Body powered hook | 44% |
| Externally powered hook | 4% |
| Body powered hand | 9% |
| Externally powered hand | 12% |
| Multi-articulated (e.g., I-Limb, Bebionic) | 18% |
| Activity specific (e.g., sports, vocational) | 7% |
| Other | 5% |
| Total | 100% |
Prosthetists reported spending 39% of their work time in clinical prosthetic patient care. (See Table 13) Out of that time, respondents spent 6% performing pre-operative consultations and 29% performing post-operative consultations, as shown in Table 40.
Table 40
| Pre-operative | 6% |
| Post-operative | 29% |
In the 2015 study, prosthetists reported that they incorporated CAD/CAM in 23% of the prostheses they provided. This percentage has increased to 30%.
Table 41
| Total CAD/CAM | 30% |
Table 42 represents a new survey question asked for the first time in this study.
Table 42
| Partial foot | 11% |
| Transtibial | 33% |
| Transfemoral | 34% |
| Upper extremity | 7% |


