Contents
- Acknowledgements
- Practice Analysis Task Force
- Introduction to a Practice Analysis
- Executive Summary & Results Highlights
- Survey Return Rate
- Results Related to Professional Background, Demographic Information and Work Setting
- Results Related to Domains, Tasks, Knowledge and Skill Statements
- Domains
- Tasks
- Knowledge and Skill Statements
- Orthotic Practice Areas and Orthoses
- Prosthetic Practice Areas and Devices
- Methodology
©2026 by the American Board for Certification in Orthotics, Prosthetics & Pedorthics, Inc. All rights reserved.
No part of this document may be produced in any form without written permission of the American Board for Certification in Orthotics, Prosthetics & Pedorthics, Inc.
Practice Analysis of Certified Practitioners in the Disciplines of Orthotics and Prosthetics
September 2022
Orthotic Practice Areas and Orthoses
Participants who indicated that they had provided direct patient care in the last 12 months were presented with a section covering either orthotic or prosthetic practice areas, as well as additional discipline-specific questions. Participants were directed to the orthotics or prosthetics section based on the discipline track they were assigned for the survey depending on their credential (CO or CP), or their preference for dually credentialed (CPO) practitioners. The results of these ratings provide guidance with regard to the development and/or refinement of ABC’s certification examinations. The results also provide guidance to the National Commission on Orthotic and Prosthetic Education (NCOPE) in the development of orthotic and prosthetic residency and education standards.
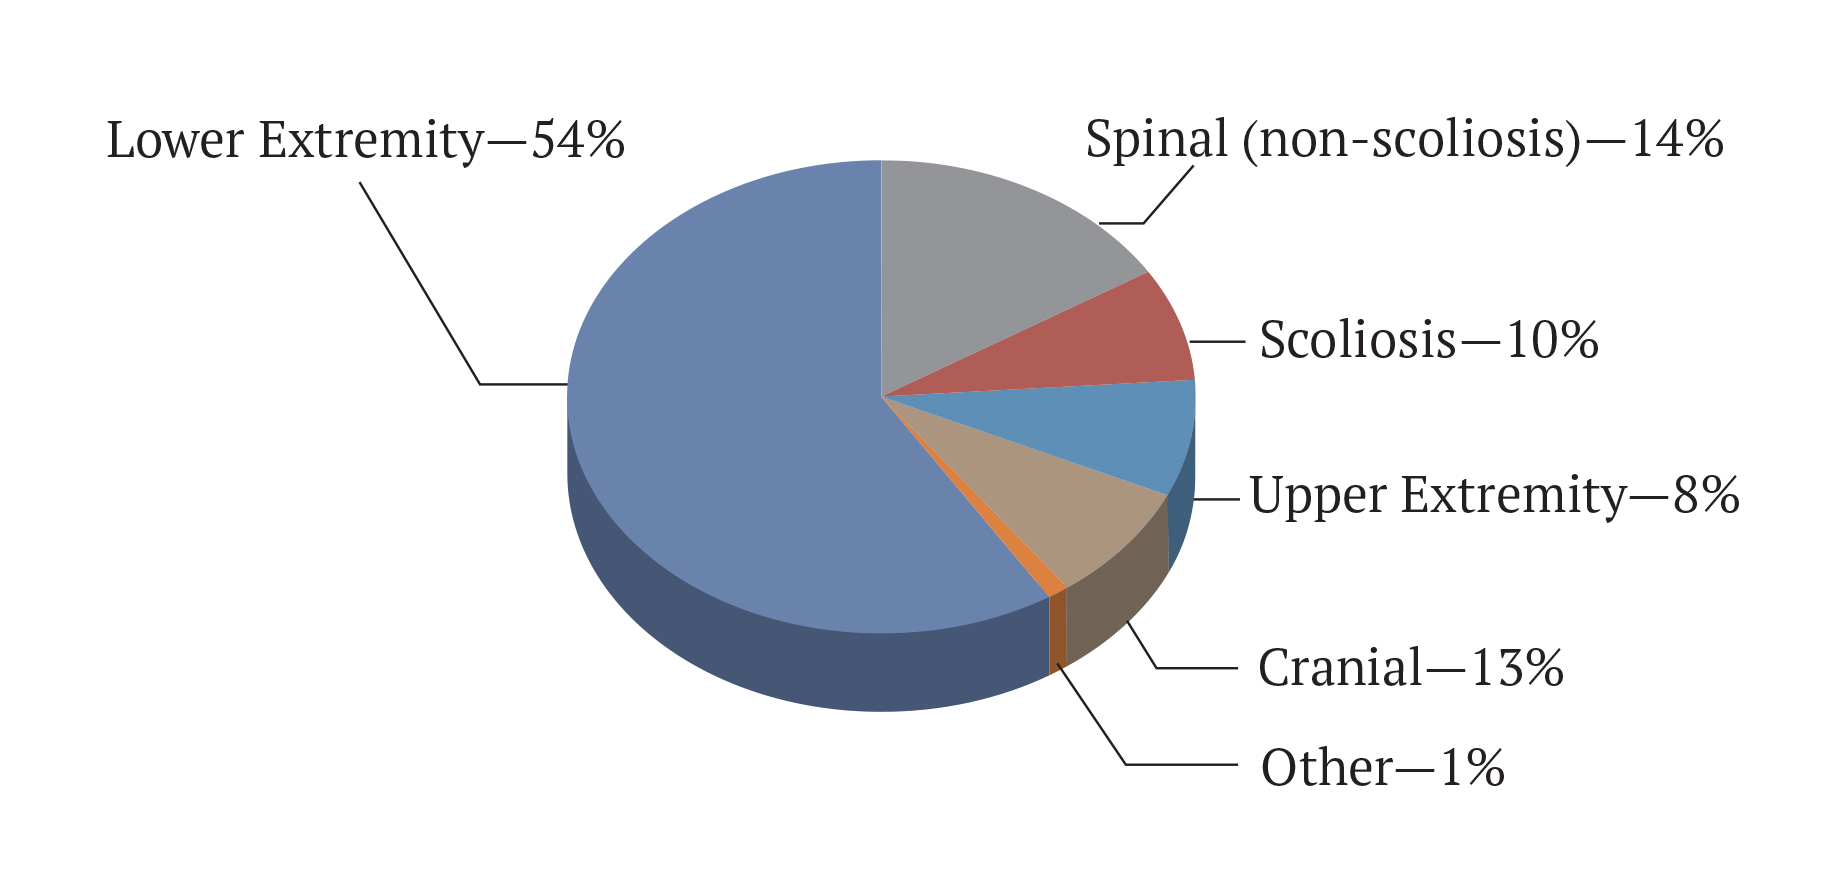
Orthotics-track respondents were asked to rate the percentage of time they spend in various orthotic practice areas. Figure 1 shows the average overall allocation of orthotic practitioners’ time in the practice areas. As can be seen, practitioners spend more than half of their time in the lower extremity practice area. There was a decrease in the percentage of time spent in lower extremity from the 2015 study (from 59% to 54%). The cranial practice area increased by 5% from the previous study and the scoliosis area also saw a small increase. These changes are consistent with the notable increase in the percentage of patients in the pediatric age range seen by orthotists.
Figure 1 – Percentage of Time in Orthotic Practice Areas
Participants were then asked to indicate the percentage of time they spend on each of the orthotic device types that were delineated within each of the five practice areas, as shown in Table 25.
Table 25
| Area | Orthoses | |
|---|---|---|
| 1. Lower Extremity | 54% | |
| Orthopedic/Diabetic shoes | 4.5% | |
| Custom shoes | 0.8% | |
| Shoe modifications | 1.5% | |
| FO/UCBL (including diabetic insert) | 6.8% | |
| Partial foot insert | 1.7% | |
| Foot abduction orthosis/Denis Browne/Ponseti | 1.6% | |
| SMO | 5.5% | |
| AFO | 18.5% | |
| FES | 0.3% | |
| KO | 4.8% | |
| KAFO | 3.3% | |
| HO | 1.2% | |
| HKAFO/RGO | 0.7% | |
| Dynamic contracture orthosis | 1.1% | |
| Prosthesis/hybrid device (e.g., foot-on-foot) | 0.5% | |
| Fracture orthosis | 1.5% | |
| Other | 0.2% | |
| Total | 54.4% | |
| 2. Spinal (non-scoliosis) | 14% | |
| LSO/TLSO semi-rigid | 4.9% | |
| LSO rigid | 1.5% | |
| Hyperextension TLSO (including Jewett or CASH) | 1.2% | |
| TLSO rigid | 3.6% | |
| CTLSO | 0.3% | |
| CTO (including Minerva and non-invasive halo) | 0.4% | |
| CO | 1.3% | |
| Halo | 0.2% | |
| Other | 0.2% | |
| Total | 13.5% | |
| 3. Scoliosis | 10% | |
| LSO | 0.8% | |
| TLSO | 8.3% | |
| CTLSO (Milwaukee) | 0.2% | |
| Tension-based scoliosis orthosis | 0.5% | |
| Other | 0.2% | |
| Total | 10.0% | |
| 4. Upper Extremity | 8% | |
| Wrist/Hand Orthoses (WHFO, WHO, HO, FO) | 5.1% | |
| EWHO | 0.3% | |
| EO | 0.9% | |
| SEWHO | 0.2% | |
| SO | 0.3% | |
| Dynamic contracture orthosis | 0.3% | |
| Fracture orthosis | 1.1% | |
| Other | 0.1% | |
| Total | 8.3% | |
| 5. Cranial | 13% | |
| Protective helmet (soft or rigid) | 3.4% | |
| Cranial remolding orthosis | 9.3% | |
| Other | 0.1% | |
| Total | 12.8% | |
| 6. Other | 1% | |
| Protective or burn facemask | 0.1% | |
| Dynamic chest compression or Pectus carinatum orthosis | 0.2% | |
| Compression garments and wraps | 0.3% | |
| Therapeutic postural-control garments (Theratogs, Wunzies) | 0.1% | |
| Soft tissue and organ protector | 0.0% | |
| Other | 0.1% | |
| Total | 0.9% |
In the orthotics-specific section, participants answered a series of additional questions about the orthoses they provided within the last 12 months. Results are shown below in Tables 26–34.
Table 26
| Conventional (metal, leather) | 12% |
| Thermoplastic | 73% |
| Thermoset/Composite | 14% |
| Additive manufactured (i.e., 3D printed) | 1% |
| Total | 100% |
The percentage of stance control KAFOs provided by orthotists decreased from 9% in the 2015 study to 6%, as shown in Table 27.
Table 27
| Mechanical (e.g., posterior offset, drop locks) | 92% |
| Stance control | 6% |
| Microprocessor | 1% |
| Total | 100% |
Custom fit (prefabricated) AFOs are more often provided than the previous study. This category increased from 18% to 22%.
Table 28
| Custom fabricated to patient model | 71% |
| Custom fabricated to patient measurement | 7% |
| Custom fit (pre-fabricated devices) | 22% |
| Total | 100% |
Table 29
| Thermoplastic | 78% |
| Carbon fiber | 14% |
| Additive manufactured (i.e., 3D printed) | 1% |
| Conventional (metal, leather) | 7% |
| Other | 1% |
| Total | 100% |
There was a significant shift in the type of prefabricated AFOs provided by orthotists. Carbon fiber type orthoses increased from 72% in the 2015 study to 82%. A similar decrease in thermoplastic AFOs was seen, from 27% to 14%.
Table 30
| Thermoplastic | 14% |
| Carbon fiber | 82% |
| Additive manufactured (i.e., 3D printed) | 1% |
| Other | 3% |
| Total | 100% |
There was a major change in the percentage of AFOs provided that utilized the AFO footwear combination, tuning or dynamic alignment method. In 2015 orthotists reported that they used one of these methods in only 18% of the AFOs they provided. That percentage grew to 44%. This may be due to the addition of dynamic alignment to the survey question in this study.
Table 31
| Total Fittings | 44% |
Orthotists reported providing more prefabricated spinal orthoses than in 2015. The percentage for this category increased from 40% to 52%. Both the other categories, custom fabricated to patient model and custom fabricated to patient measurement, decreased from the 2015 study.
Table 32
| Custom fabricated to patient model | 20% |
| Custom fabricated to patient measurement | 28% |
| Custom fit (pre-fabricated devices) | 52% |
| Total | 100% |
Table 33
| Nocturnal (supine) | 26% |
| Full time (non-supine) | 74% |
| Total | 100% |
Table 34
| Foot orthoses (non-diabetic inserts) | 22% |
| Foot orthoses (diabetic inserts) | 25% |
| Lower extremity | 11% |
| Spinal | 17% |
| Scoliosis | 35% |
| Upper extremity | 1% |
| Cranial | 55% |
| Total | 100% |


